The purpose of this page is to outline options for estimating uncertainties related to the specific measurement configuration under which the test item is measured, given other possible measurement configurations. Some of these may be controllable and some of them may not, such as:
instrument
operator
temperature
humidity
The effect of uncontrollable environmental conditions in the laboratory can often be estimated from check standard data taken over a period of time, and methods for calculating components of uncertainty are discussed on other pages. Uncertainties resulting from controllable factors, such as operators or instruments chosen for a specific measurement, are discussed on this page.
The approach depends primarily on the context for the uncertainty statement. For example, if instrument effect is the question, one approach is to regard, say, the instruments in the laboratory as a random sample of instruments of the same type and to compute an uncertainty that applies to all results regardless of the particular instrument on which the measurements are made. The other approach is to compute an uncertainty that applies to results using a specific instrument.
To treat instruments as a random source of uncertainty requires that we first determine if differences due to instruments are significant. The same can be said for operators, etc.
To evaluate the measurement process for instruments, select a random sample of I (I > 4) instruments from those available. Make measurements on Q (Q >2) artifacts with each instrument.
For a graphical analysis, differences from the average for each artifact can be plotted versus artifact, with instruments individually identified by a special plotting symbol. The plot is examined to determine if some instruments always read high or low relative to the other instruments and if this behavior is consistent across artifacts. If there are systematic and significant differences among instruments, a type A uncertainty for instruments is computed. Notice that in the graph for resistivity probes, there are differences among the probes with probes #4 and #5, for example, consistently reading low relative to the other probes. A standard deviation that describes the differences among the probes is included as a component of the uncertainty.
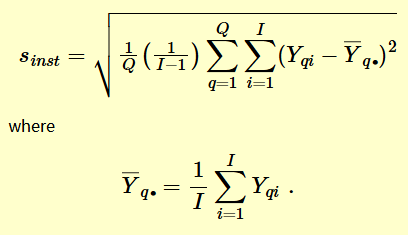
Given the measurements,
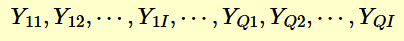
for each of Q artifacts and I instruments, the pooled standard deviation that describes the differences among instruments is:
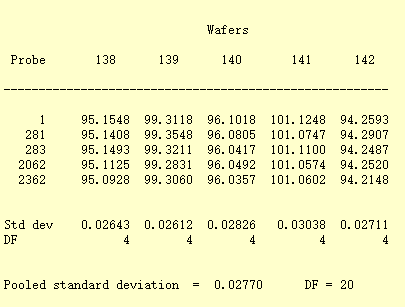
A two-way table of resistivity measurements (ohm.cm) with 5 probes on 5 wafers (identified as: 138, 139, 140, 141, 142) is shown below. Standard deviations for probes with 4 degrees of freedom each are shown for each wafer. The pooled standard deviation over all wafers, with 20 degrees of freedom, is the type A standard deviation for instruments.